Budgeting for Schools Made Easy With Practical Allocation Strategies
Learn budgeting for schools with this step-by-step guide to funding sources, budget types, allocation templates, and calendar planning.
Why Strategic Budgeting For Schools Matters
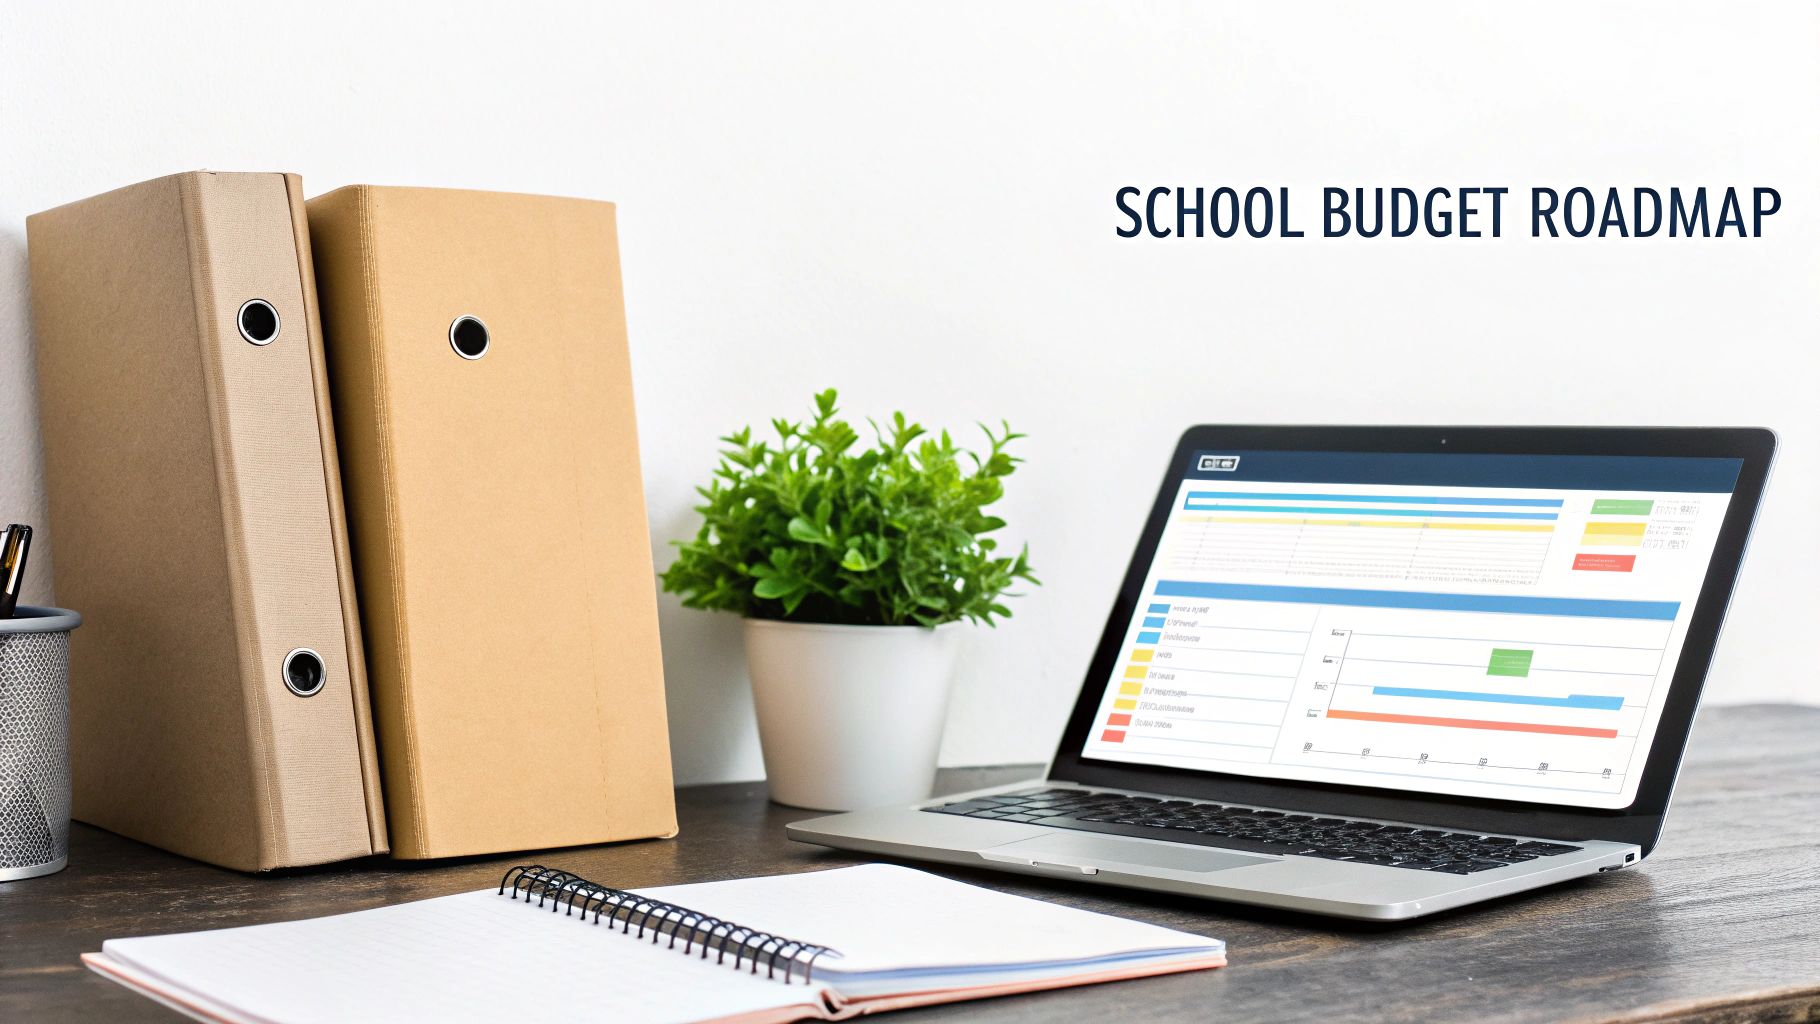
Treating your school’s budget like a detailed roadmap can make the difference between scrambling for funds and confidently hitting every milestone. A structured budgeting process brings clarity and alignment across district teams, from superintendents to cafeteria staff.
By anticipating needs and cutting unnecessary costs, districts can turn raw numbers into data-driven decisions that support student success.
Key areas we’ll explore include:
- Core Concepts and Funding Streams that shape operational and capital outlays
- Annual Budget Calendar highlighting planning checkpoints and procurement cycles
- Allocation Templates and Formulas for per-student and line-item cost calculations
- Common Pain Points and Constraints with tactical ways to overcome them
- Vendor Alignment Strategies to sync sales efforts with district budget timing
- Schooleads Tools and Insights to zero in on the right decision-makers
Key Benefits Of Structured Budgeting
When every expense ties back to an outcome, resources stretch further. Schools see:
- Sharper Decision-Making by tracking actual spend versus goals
- Optimized Spending that prioritizes classroom needs
- Enhanced Accountability through transparent reports
- Proactive Forecasting to spot gaps before they become crises
Overview Of School Budget Categories And Funding Streams
Below is a quick reference showing the main budget buckets, where the money typically comes from, when you need to plan—and the factors you can’t ignore.
| Budget Category | Funding Source | Typical Timing | Key Considerations |
|---|---|---|---|
| Operating | Local and state revenues | Fall planning | Ongoing expenses |
| Capital | Bonds and grants | Multi-year | Project approvals |
| Grants | Federal and state awards | Varies by cycle | Compliance required |
| Special Projects | Donations and partnerships | Project-based | Flexible use |
This overview gives you a high-level snapshot to match funding sources with planning milestones.
Tip: Mapping funding streams early clarifies timing and compliance needs.
What’s Included In This Guide
Our journey moves from basic building blocks to hands-on examples. You’ll find:
- A breakdown of each budgeting phase with clear action steps
- Sample allocation templates complete with formulas for per-student and line-item costs
- A visual budget calendar to keep you on track
- Real-world case studies showing how districts adapt and vendors align
How To Use This Guide
Flip to the section you need or read straight through for the full picture. Every chapter ends with quick-hit tips to reinforce your next move:
- Use Schooleads filters to zero in on districts by budget size or decision-maker role (see Schooleads for details)
- Tap into market intelligence to time outreach right when procurement windows open
By tailoring each step to your district’s rhythm—and your sales goals—you’ll turn this guide into a living roadmap.
Next up: we’ll unpack core budgeting concepts before diving into templates, calendars, and real examples. Ready to build a stronger budget? Let’s get started.
Understanding Key Concepts
Imagine managing a district’s budget just like your own household finances. The operating budget covers everyday bills—think utilities and staff paychecks—while capital funds handle the big-ticket items, like playground upgrades or new classrooms. This simple comparison clears up confusion and keeps every spending decision grounded.
Operating Versus Capital Budgets
Operating budgets take care of the routine: classroom supplies, utility bills, substitute teachers. Capital budgets, on the other hand, fund those once-in-a-blue-moon projects—campus renovations, major technology overhauls.
- One-time buys go in capital: new equipment, facility improvements
- Recurring bills stay in operating: software licenses, maintenance contracts
- A hybrid tracking system flags how often each expense comes around
Labeling costs correctly prevents the dreaded mid-year money squeeze.
Forecast Anchors And Carryover Transparency
Think of enrollment projections as your budget’s compass: they steer revenue forecasts and keep surprises at bay. Get that headcount wrong, and you might undershoot essential funding formulas—or end up with idle cash that could’ve fueled new programs.
Carryover balances are simply the unspent funds rolling over from last year. Sharing these figures openly builds confidence with board members, parents, and staff.
“Clear visibility into leftover dollars empowers planners and shows where resources can stretch further.”
Practical Examples Of Rising Costs
Benefit expenses often climb faster than base pay. When healthcare premiums jump by 7%, districts must shuffle funds in the operating lines to cover the extra outlay.
Changes in student numbers add another twist. A sudden 5% enrollment boost demands more teachers, textbooks, and cafeteria trays. And if enrollment dips, you’ll feel that ripple effect in every corner.
On the bigger stage, public education funding typically runs at 4%–5% of GDP, with governments pitching in 60%–70% of total spending. Globally, the education market has swelled to US$7.6 trillion. For a deeper dive, see the HolonIQ report on global education spending.
One-Time And Recurring Costs
Picture one-time expenses—like buying a new school bus—as a major home renovation. Recurring costs—custodial services or subscription fees—are more like your monthly utility bills.
- Reserve capital for items over $50,000
- Budget annual operating funds for subscriptions and contracts
- Audit both lines every quarter to catch budget drift early
A clear split between these categories keeps large bills from hijacking your plan.
Why Analogy Matters
Framing school budgets as household expenses cuts through jargon. When district leaders speak in everyday terms, stakeholders from PTA members to board directors tune in instead of tuning out.
"Framing budget types as familiar expenses accelerates understanding."
Key Takeaways
- Operating funds power daily needs; capital funds fuel big projects
- One-time and recurring expenses balance like nutrition and exercise
- Transparent forecasts and carryovers build trust with all stakeholders
- Relatable analogies help everyone—from teachers to taxpayers—grasp complex concepts
These fundamentals set the stage. In the next chapter, we’ll connect operational, capital, grant, and special-project budgets—and equip you with templates, calendars, and allocation tools to put these ideas into practice.
Exploring Budget Types And Funding Sources
Districts juggle multiple funds to cover daily operations and long-term projects. Understanding each budget type is essential for clear tracking and staying audit-ready.
Major Budget Categories
When you break it down, four main buckets keep everything organized:
- Operational covers everyday essentials like staff paychecks, utility bills, and classroom supplies.
- Capital is set aside for big investments—think building renovations or a new set of laptops.
- Grants come from federal and state programs with specific goals and reporting requirements.
- Special Projects rely on donations or partnerships to launch initiatives outside the core budget.
These categories prevent money from getting mixed up and simplify reconciliation.
| Funding Source | Description | Timing | Key Focus |
|---|---|---|---|
| Federal Grants | ESSA, Title I programs with strict use rules | Formula cycles | Compliance monitoring |
| State Allocations | Per-pupil funding based on enrollment counts | Annual | Population shifts |
| Local Taxes | Property tax revenue set by districts | Ongoing | Community variance |
Having this map of funding streams lets you plan around deadlines and meet all reporting rules.
Estimating Per Pupil Funding
Districts usually blend federal, state, and local dollars into a single per-student figure. For instance, national data show public K–12 spending averages $15,500 per student, with $2,400 from federal grants and the balance covered by state and local taxes. Personnel costs often account for 70%–80% of that total.
- Operating budgets handle recurring needs like payroll, utilities, and materials.
- Capital budgets reserve funds for one-off projects such as building upgrades or buses.
For further details, see the public education spending statistics.
Tracking And Blending Funds
Mixing streams demands strict bookkeeping and a sharp eye on grant rules. Categorical grants typically require separate ledgers and timely reports to avoid audit issues.
“Clear tracking of fund flows prevents compliance issues and informs smarter allocations.”
Try these tactics:
- Assign unique ledger codes for each funding source.
- Schedule quarterly reviews to reconcile expenditures and audit logs.
- Use budgeting software with tagging features to automate fund separation.
With this visibility, budget officers can reallocate mid-year when priorities shift, and vendors can target districts with strong capital or grant reserves.
Federal Versus State Grant Differences
Federal grants often carry tight spending rules tied to specific objectives, while state funds follow per-pupil formulas that fluctuate with enrollment. To keep things straight:
- Review grant guidelines at the planning stage to avoid mid-year reallocations.
- Maintain separate tags or spreadsheets for each grant to simplify audits.
Importance Of Local Taxes
Local property taxes often make up the largest share of school revenue. Districts set rates via community votes and track assessed values to forecast both operating and capital needs. Staying on top of those numbers is crucial for accurate projections.
Sample Budget Blend Case
Consider a rural district that needed a new wing and modern STEM labs. They:
- Used capital funds for construction and grants for lab equipment.
- Assigned salaries to the operating budget while tagging equipment costs to grant codes.
- Spotted a 10% underrun in grant spending during quarterly reviews and reallocated it to afterschool programs.
This approach kept projects on track and maximized external funding.
Using Schooleads For Targeting
Schooleads makes outreach more precise by offering filters for budget categories and funding levels. You can:
- Search for districts with high capital reserves or specific grant awards.
- Leverage market intelligence to time your pitch around procurement windows.
- Combine funding data with compliance calendars for a full view of district needs.
That kind of insight lets vendors connect with decision-makers exactly when budgets open for new purchases.
Annual Budgeting Calendar And Procurement Cycles

Each year kicks off in January when districts set enrollment forecasts, which shape about 75% of state funding. Think of this step as laying the foundation before a building goes up.
By February, finance teams draft initial budgets. These early outlines get fine-tuned during stakeholder hearings in March, so adjustments are smoother.
Planning Phase Milestones
- January Enrollment Forecasting
- February Proposal Drafts
- March Public Hearings
- April Revision Window
- May Board Review
- June Adoption Deadline
After approval, districts switch gears to procurement—ordering textbooks, technology and other essentials. Miss a deadline and it’s like showing up late for a final exam: opportunities slip away.
Think of your budget calendar as a school timetable, where each block signals an important assignment. A color-coded schedule helps every team member hit their marks.
Aligning Procurement Windows
Textbook bids typically open in June, with awards by August. Technology follows a July–September schedule, syncing with back-to-school needs.
October state reporting deadlines call for a two-week buffer to avoid late fees or funding gaps.
Buffer periods protect budgets by allowing time for unexpected delays in invoicing or approvals.
Tips For Syncing Finance Reviews
- Plug every grant deadline into your calendar.
- Host cross-team check-ins at least once a month.
- Automate reminders two weeks before key procurements.
- Reserve late-spring slots for capital project approvals.
Following these steps cuts down on last-minute rushes and keeps everyone informed.
Using Schooleads For Timing And Outreach
- Filter districts by month and budget size to plan demos.
- Target administrators when capital reserves are highest.
- Adjust outreach based on upcoming procurement dates.
- Export contact lists for CRM or Slack reminders before milestones.
Visualizing The Full Cycle
| Quarter | Milestone | Action |
|---|---|---|
| Q1 | Enrollment Forecasts, Draft Proposals | Color-coded calendar with team assignments |
| Q2 | Public Hearings, Revisions | Stakeholder engagement sessions |
| Q3 | Board Reviews, Adoption | Final sign-off and budget publication |
| Q4 | Procurement, Reporting | Purchase orders processed, compliance tracked |
Nearly 90% of districts follow this pattern, yet 40% still miss deadlines due to poor timing.
Common Pitfalls To Avoid
- Skipping public hearings can leave needs unaddressed.
- Ignoring buffer periods risks penalties.
- Overlooking grant dates forces mid-year reallocations.
You might be interested in learning more about engaging purchase decision-makers in K-12 districts. Check out our guide at Understand Purchase Decision-Makers.
A clear calendar paired with a solid procurement plan keeps resources on track, supports compliance, and aligns district leaders all year round. Regular updates ensure teams stay aligned and boost overall budget compliance.
Sample Allocation Templates And Formulas
A good template turns vague budget categories into precise numbers you can act on. In this section, K-12 finance teams will learn how to calculate per-student costs, set aside maintenance reserves, and plan for technology upgrades.
Instructional Cost Formula
Calculating the instructional cost per student ties your spending directly to enrollment. It removes guesswork and keeps funding transparent.
- Formula: Total Instructional Budget ÷ Total Enrollment = Per-Student Cost
- Example: A district with 1,500 students and a $3,000,000 instructional fund ends up with $2,000 per student.
“Breaking down costs per student highlights funding efficiency and pinpoints areas for review.”
Maintenance And Upgrade Reserves
Setting aside funds for upkeep means you’re not caught off guard by a leaky roof or a failing HVAC system. A common rule of thumb is 5% of your operating budget.
- Identify your Total Operating Budget
- Multiply by 0.05
- Move the result into a dedicated reserve account (ledger code “MTN-RES”)
Key Insight: Regular reserve contributions smooth cash flow and limit emergency spending.
Template For District Budget Allocation
Below is a sample table showing how line items, formula logic, and projected costs come together for a hypothetical district. Use it as a starting point to adjust numbers based on your own student counts and price assumptions.
| Line Item | Formula | Projected Cost | Notes |
|---|---|---|---|
| Instructional Cost | Total Instructional Budget ÷ Total Enrollment | $3,000,000 | 1,500 students at $2,000 each |
| Maintenance Reserve | Total Operating Budget × 0.05 | $1,000,000 | 5% of a $20,000,000 budget |
| Technology Upgrades | Device Cost × Number of Devices | $300,000 | 500 laptops at $600 each |
| Transportation | Mileage Rate × Fleet Size | $150,000 | 20 buses at $0.75/mile, 10,000 miles each |
| Extracurricular | Historical Cost ÷ Enrollment × Club Count | $50,000 | 25 clubs, average of 40 students per club |
Use this layout to swap in your own figures and formulas. It keeps everything in one place and makes mid-year tweaks a breeze.
Case Study 1500 Student District
Imagine a district with 1,500 learners, each line item tagged by ledger codes and assumptions.
- Salaries live in rows 2–50 with a simple SUM formula.
- Supply costs in rows 51–75 use SUMIF to filter “SUP.”
- Facility expenses in rows 76–100 rely on SUMIFS for “FAC” and fiscal year filters.
Below is a screenshot from our sample budget template showing these columns and formulas in action.

This view makes it simple to update headcounts or price changes without hunting through multiple tabs.
Best Practices For Customization
Every district has its own quirks. Here’s how to bend templates to your needs:
- Transportation: Multiply average mileage rates by bus fleet size.
- Extracurricular Programs: Allocate per-club funding based on past participation.
- Special Grants: Tag grant items with codes like “GRNT-TitleI.”
To align your outreach with fiscal cycles, check out our guide on education marketing strategy for tips on timing your vendor pitches.
“Custom tags and clear notes save hours during audit season.”
Documenting And Adjusting Forecasts
Clear notes on assumptions make mid-year updates painless. A simple table with original forecasts, updated values, and drivers of change helps everyone stay on the same page.
- Assumption Column: Tracks initial forecasts and revised figures.
- Unit Cost Column: Monitors price shifts for items like textbooks or devices.
- Change Driver Column: Explains why numbers moved (enrollment trends, vendor rebates).
Nearly 48% of districts revise budgets mid-year because of enrollment swings or supply cost hikes. A well-structured forecast table lets you reconcile projected versus actual spend and keeps leadership in the loop.
“An audit-ready template shows exactly why each figure changed and who approved it.”
Keeping these tables current builds trust with stakeholders and speeds up reporting, cutting down on manual errors and boosting overall accuracy.
Common Pain Points And Constraints
District budget planning can feel like steering a ship through hidden reefs. When everything seems on course, a sudden jolt can send the whole plan off balance.
A mid-year dip in enrollment, rising pension costs, and unexpected healthcare spikes often hit in the same fiscal period. That cocktail of pressures tightens every line item.
For instance, one California district saw its student body shrink by 5% halfway through the year. They ended up tapping a $12 million facilities fund just to cover payroll.
- Enrollment Volatility leads to revenue gaps when headcounts shift.
- Pension Liabilities force more operating dollars into retirement plans.
- Unplanned Repairs require quick capital outlays, derailing long-range projects.
- Healthcare Spikes consume funds meant for classrooms, prompting cuts.
These scenarios can trigger mid-year shortfalls, leaving leaders to scramble or shutter programs.
“Stocking small reserves around critical line items prevents scrambling when costs jump.”
Strategies To Build Resilience
- Build a 3% contingency reserve early in the cycle. That safety net lets you absorb emergencies without borrowing.
- Negotiate vendor contracts with built-in price-adjustment clauses. You won’t be locked into peak rates if market costs climb.
- Deploy real-time dashboards to monitor cash flow and flag risks like delayed reimbursements before they escalate.
| Constraint | Mitigation Tactic |
|---|---|
| Enrollment Drops | Scenario-based forecasts with tiered actions |
| Pension Liabilities | Gradual employer contribution adjustments |
| Facility Repairs | Dedicated maintenance reserve |
| Healthcare Spikes | Wellness initiatives and periodic plan reviews |
Internal Controls And Aid Tracking
Strong internal controls do more than satisfy auditors—they speed up grant disbursements, too. Digital audit trails reveal exactly how every dollar moves.
Recent humanitarian crises have strained global education budgets, driving up per-pupil deficits. Learn more in the Global Estimates Report 2025.
- Assign a dedicated grant coordinator to track award conditions and deadlines.
- Automate reminders for every reporting milestone to avoid missed windows.
- Use a digital ledger to log expenses and approvals in real time.
“Managing grants proactively slashes processing times and cuts compliance risk.”
These measures help districts anticipate common pitfalls and safeguard core programs, even under tight budgets.
Cross-functional reviews flag hidden cost drivers before they snowball into crises.
- Hold quarterly budget check-ins with finance, curriculum, and operations teams.
- Share dashboard insights with board members for early course corrections.
- Work with vendors on phased deliveries and flexible payment plans.
- Update your risk matrix monthly to reflect shifting priorities.
Regular checkpoints minimize surprises and keep funds flowing to what matters most—student services and classroom learning.
By embedding flexibility and foresight into every step, districts turn potential budget shocks into manageable challenges. Anticipate, adapt, and keep education on track.
Frequently Asked Questions
Managing school budgets brings its own set of puzzles, and K-12 leaders often face the same questions. Below, you’ll find straightforward answers designed to sharpen your planning and spending.
Spreading your funding sources cushions your budget against surprises.
Funding Sources
- What are K-12’s most consistent revenue streams? Local property taxes form the backbone of most district budgets. Next come state formula grants, and targeted federal awards can fill critical gaps. A balanced approach keeps funding stable.
- How can districts adjust when enrollment shifts unexpectedly? Build scenario-based forecasts that model different student counts. Pair them with flexible staffing plans so you can reallocate resources quickly.
Compliance Controls
- How do I ensure every grant dollar is used correctly? Stand up a dedicated grant management team, keep audit-ready records, and schedule recurring spending reviews. This setup helps you catch issues before they become audit findings.
- Which tools make budget tracking effortless? A real-time dashboard tool combined with monthly variance reports offers instant visibility. Clear visuals and early alerts let you tweak projections right away.
Best Practices
- Conduct a revenue-mix review every quarter for balance and transparency.
- Run enrollment/cost scenario tests each semester to forecast changes.
- Tag expenses with precise ledger codes to simplify audits.
- Automate variance alerts so small discrepancies don’t snowball.
These FAQs serve as a quick reference to tackle common budgeting challenges. Lean on them to refine your processes, sidestep mistakes, and keep district finances on solid ground.
Bookmark this page and revisit it at the start of every budget cycle. Share it with your finance team and board to keep everyone aligned.
Access verified contacts, budget insights, and procurement timing alerts with Schooleads. Your outreach will hit decision-makers exactly when budgets open.
Ready to reach decision-makers as budgets open? Use Schooleads: https://schooleads.com